Monitoring of network conditions
Facts
- Source Code:
- Helm Chart: https://github.com/ERIGrid2/charts/tree/master/charts/perfsonar
- State: design phase
Introduction
One of the objectives of RIasC is the facilitation of distributed experiments such as for example geographically distributed real-time simulation (GD-RTS). This is enabled by the interconnection of research infrastructures between different universities, countries and even continents which host digital real-time simulators and/or controller/power hardware-in-the-loop (C/PHIL) setups.
Among other services, RIasC provides an transparent overlay network to establish IP connectivity between the locations. This IP overlay network is established via a peer-to-peer topology. Meaning, as long as permitted by network policies, traffic will be exchanged directly between each of the labs rather than being routed over a central VPN gateway. In cases where direct communication is blocked, traffic is rerouted over a third party. Hence, from a user perspective, all participating laboratories appear to connected to the same local network.
However, due to the geographical distances between them a considerable communication latency exists. To compensate the effect of these increased communication latencies, an interface algorithm (IA) is required.
In most cases the IA requires the current communication network state as an input.
For this purpose, RIasC implements network monitoring which periodically monitors several network metrics such as bandwidth, latency, packet loss, etc.
The network monitoring feature of RIasC is based on the established perfSONAR tool suite and adapts it for its usage in a Kubernetes cluster. This includes the deployment of perfSONAR core components in the cluster itself as well as the execution of perfSONAR test points on the agent nodes throughout the participating research infrastructures. Last but not least, a dedicated Kubernetes operator is used to manage test schedules by the means of Kubernetes Custom Resource Definitions (CRD).
Relation to other RIasC services
The network monitoring service depends on two other RIasC services:
- IP Overlay Network: In order to perform actual network tests, an IP connectivity between the testing endpoints is required. This connectivity can either be provided by the existing local or wide-area networks (the Internet). However, in most cases test points are either not located within the same local network or their direct communication is prohibited by firewalls. In theses cases the network monitoring tests can utilize the overlay network to tunnel the execution of tests through the overlay network.
- Time-synchronization: Some network tests measure a one-way delay (OWD) between two testing endpoints. This is facilitated by sending a timestamp of the current time from one test point to another an calculating the difference upon reception. However, this is only possible as long as both the local clocks of the sending and receiving endpoints are synchronized.
Collected Metrics
- Connectivity
- Latency
- Bandwidth
Employed technologies
The network monitoring service largely depends on the following already established software projects:
Architecture
The following figure shows the architecture of perfSONAR:
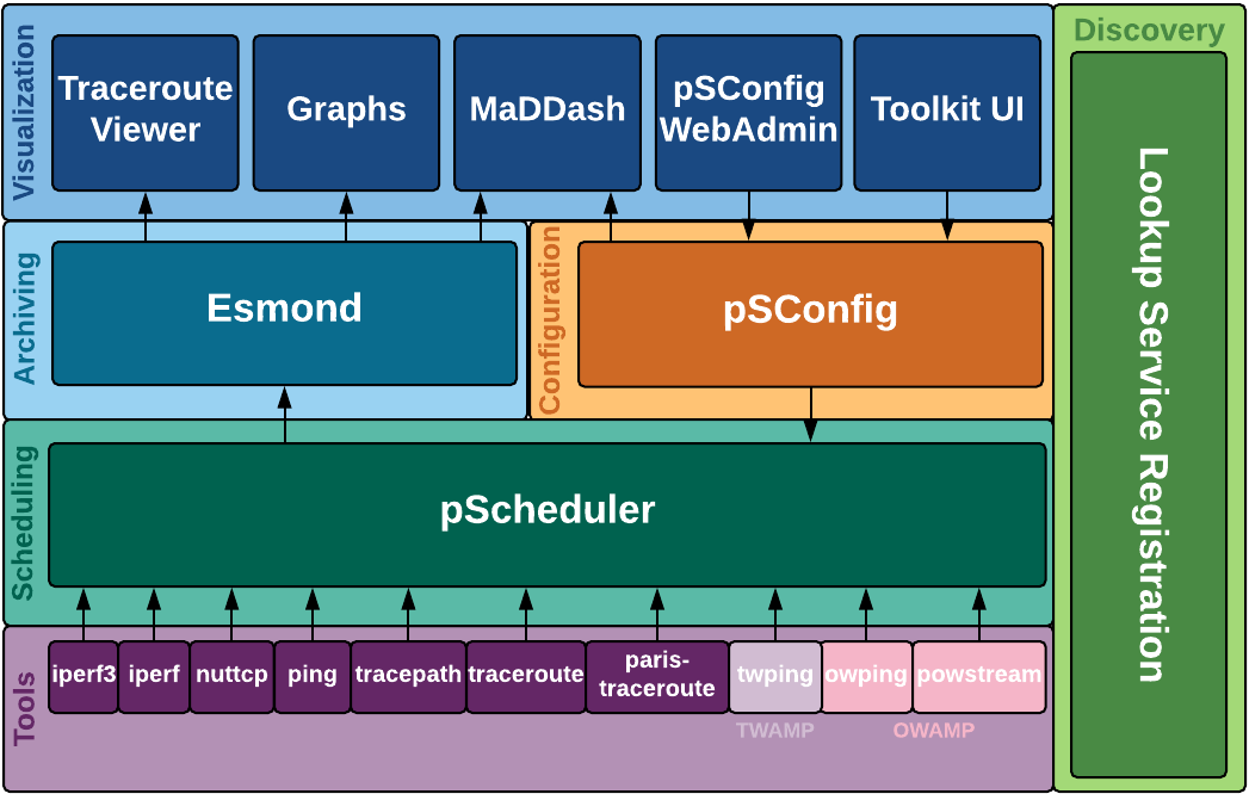
It consists of several central components which are deployed once in a cluster. These central components are:
- Web-interfaces for visualization: Graphs, MaDDash
- Web-interfaces for configuration of testing schedules: pSConfig WebAdmin
- Archiving server for test results: esmond
- pSConfig Server
These central components are deployed once within the Kubernetes cluster by the cluster operator.
In addition, the lower part of the figure shows the software components which are running on each of the test points. They are all packaged within a single container image.